Azure Monitor is the unified monitoring solution within Azure. It can be used to monitor Azure or non-azure workloads. In this post, I’m discussing how to monitor the status of a windows service running on Azure VM using log analytics and Azure alerts.
Summery
In brief, you need to create a log analytics workspace, deploy monitoring agents to the required servers, configure performance counters within the log analytics workspace to capture the system events, run a log query to identify the service and its status, and create an Azure alert to monitor the status of the service and generate an email when the status of the has service changed.
Follow the below step and step guidance.
Create Log Analytics workspace and configure performance counters
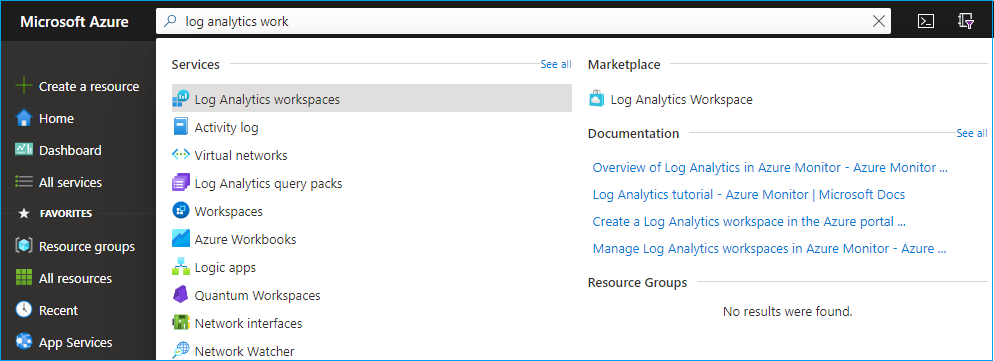
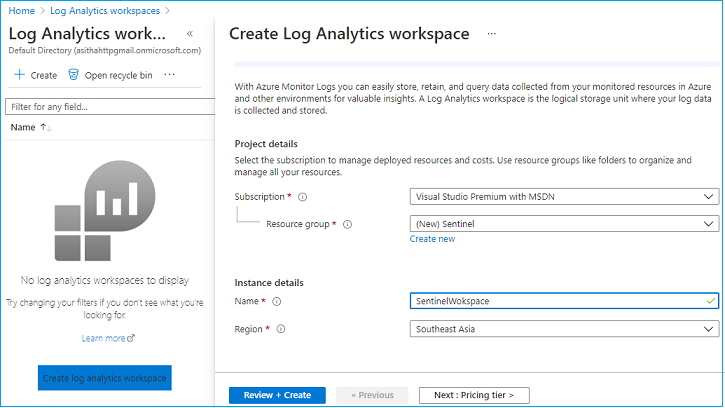
- You can create a new Log Analytics workspace or use any existing workspace you have. To create a new Log Analytics workspace, Login to Azure Portal, Type Log Analytics workspace, and click Create


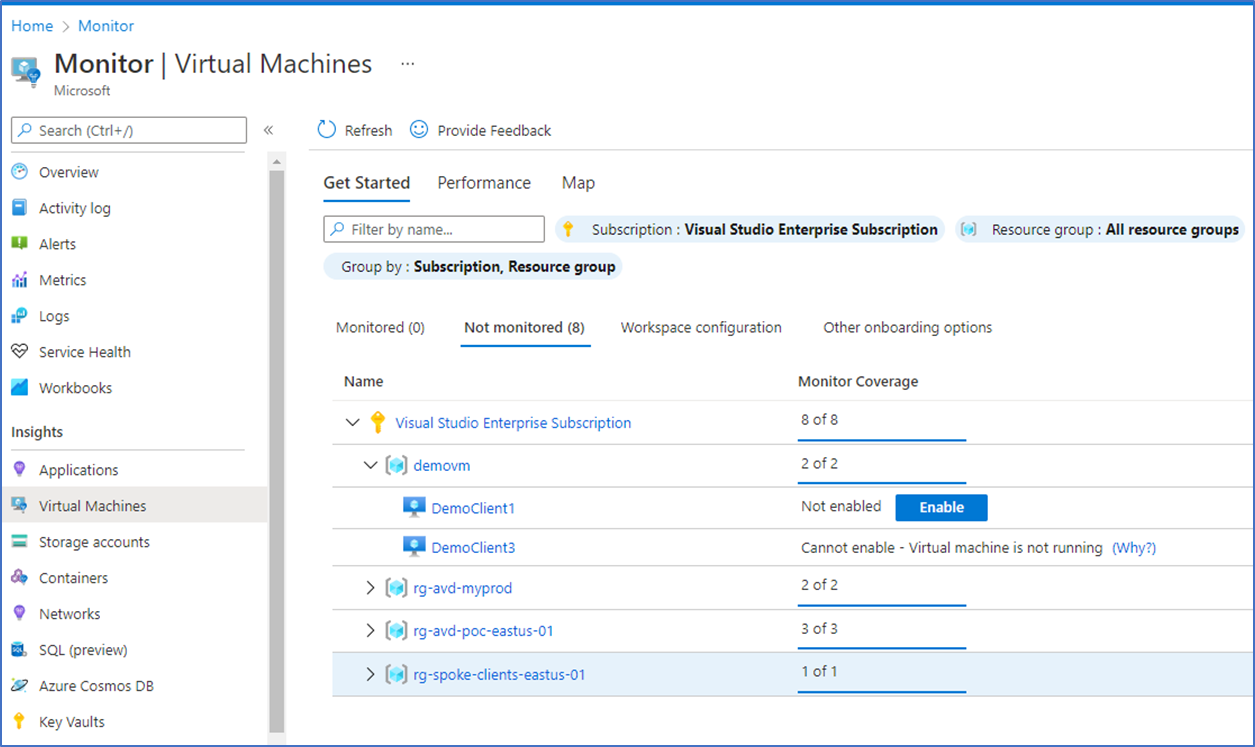
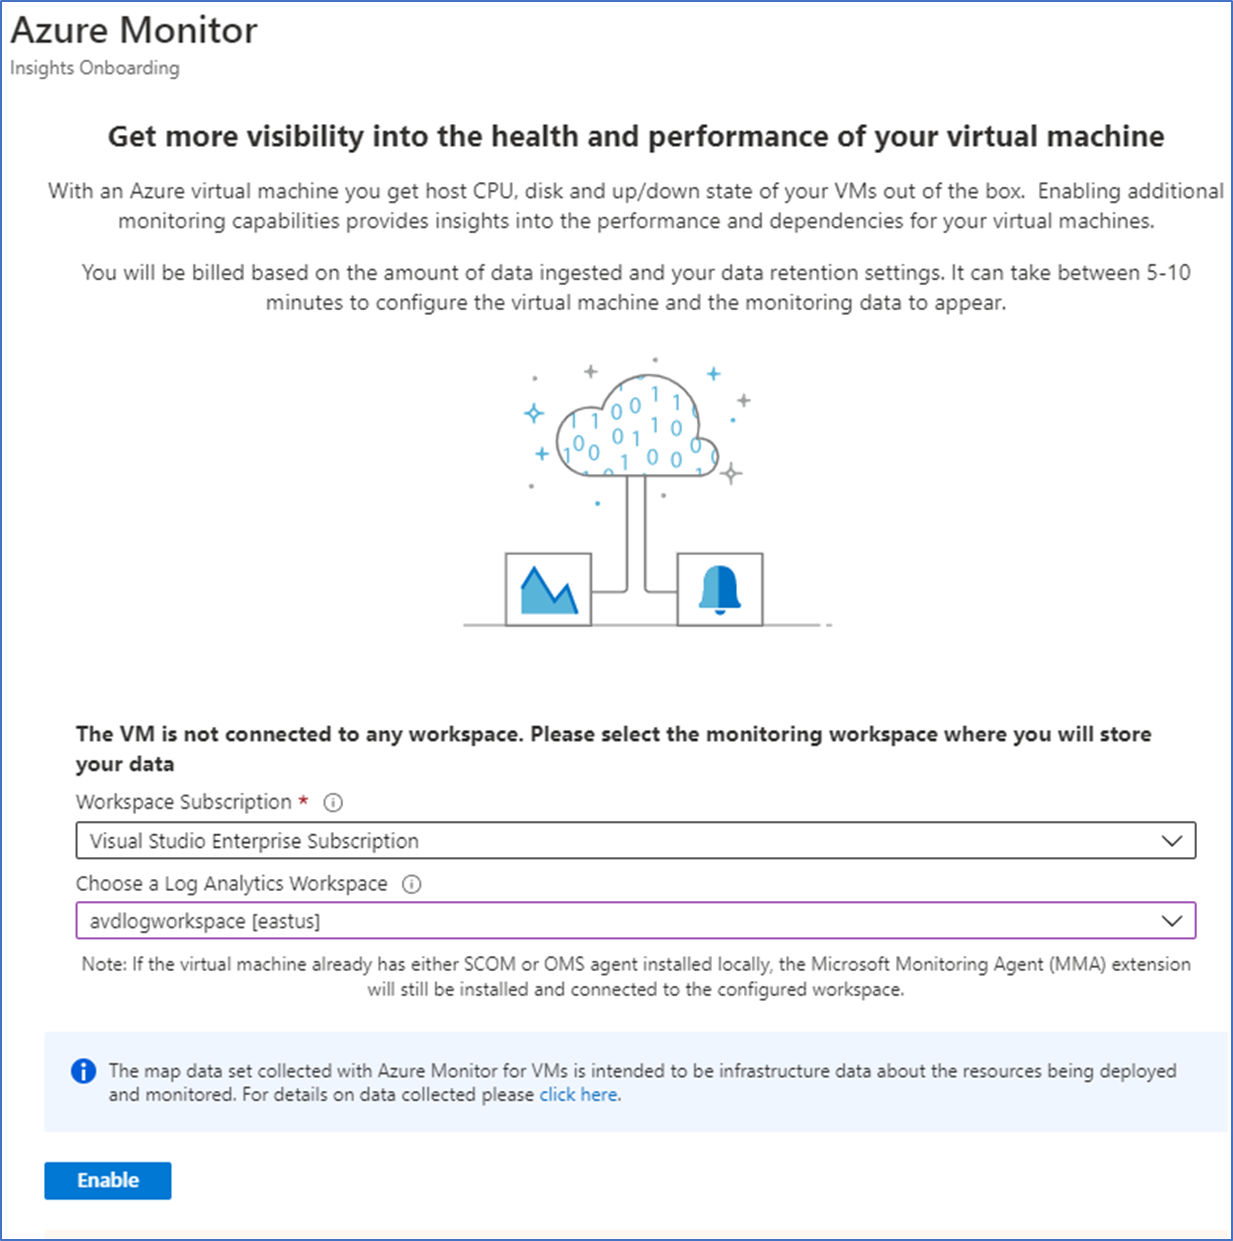
- Log Analytics agent (Microsoft monitoring service agent) is required in VM’s to capture the system events. There are a few ways to deploy the agent but I’m using the Azure portal.
Log in to the Azure portal – Monitor – Virtual Machines – Not monitored

- Select the VMs that need to deploy the agent, select the Log Analytics workspace and click Enable

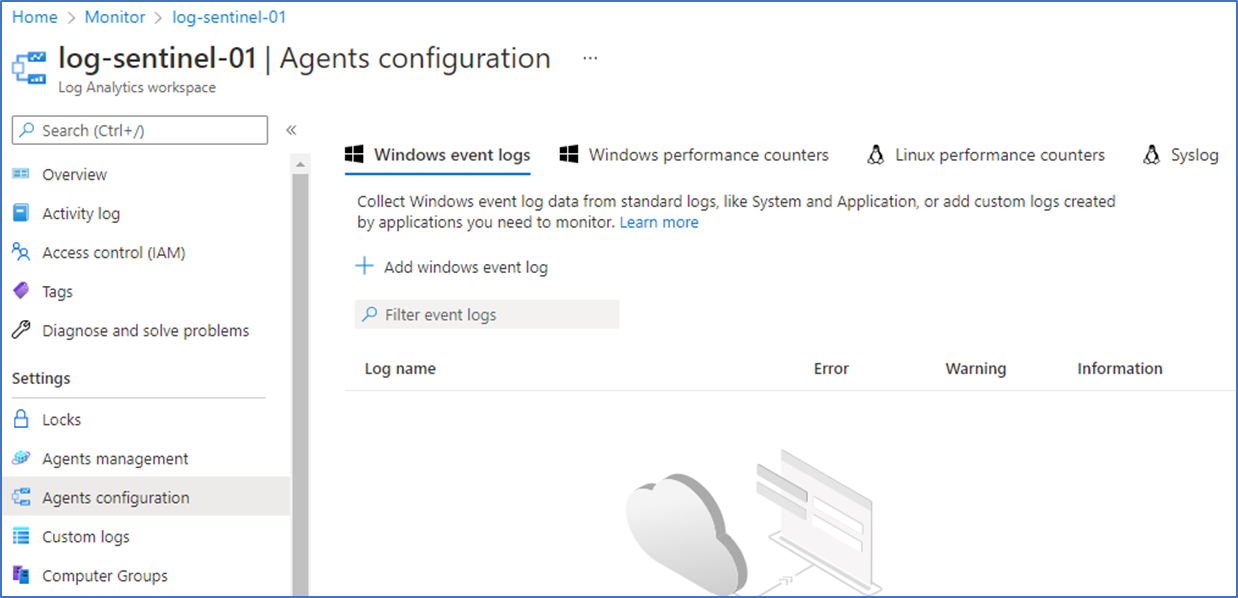
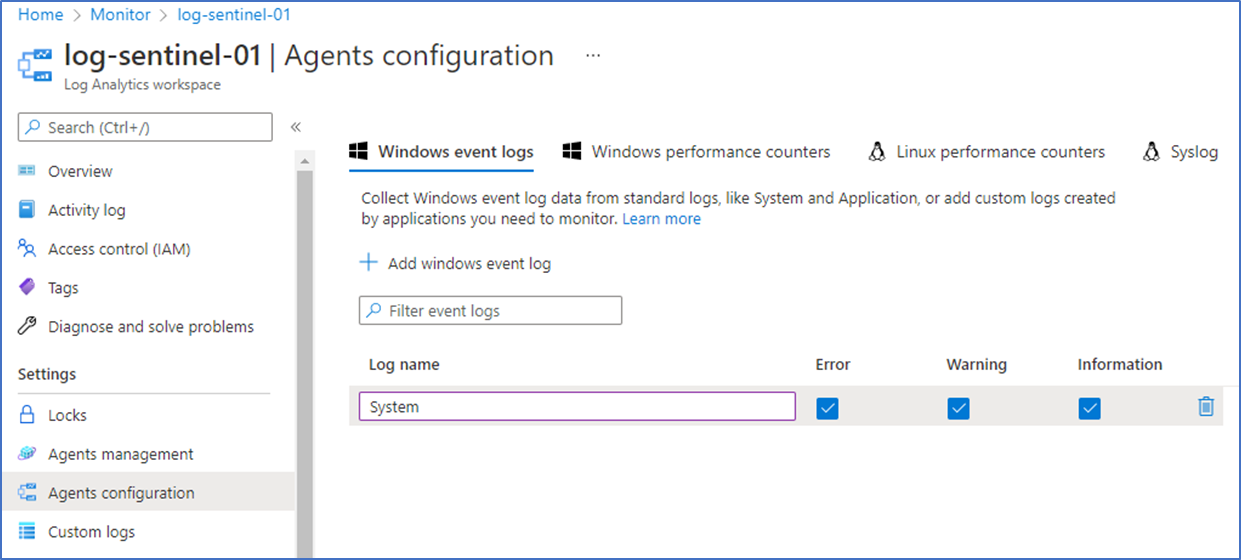
- Next you need to configure the performance counters to grab system events to read the service states.

- Click Event log and select System event logs and apply

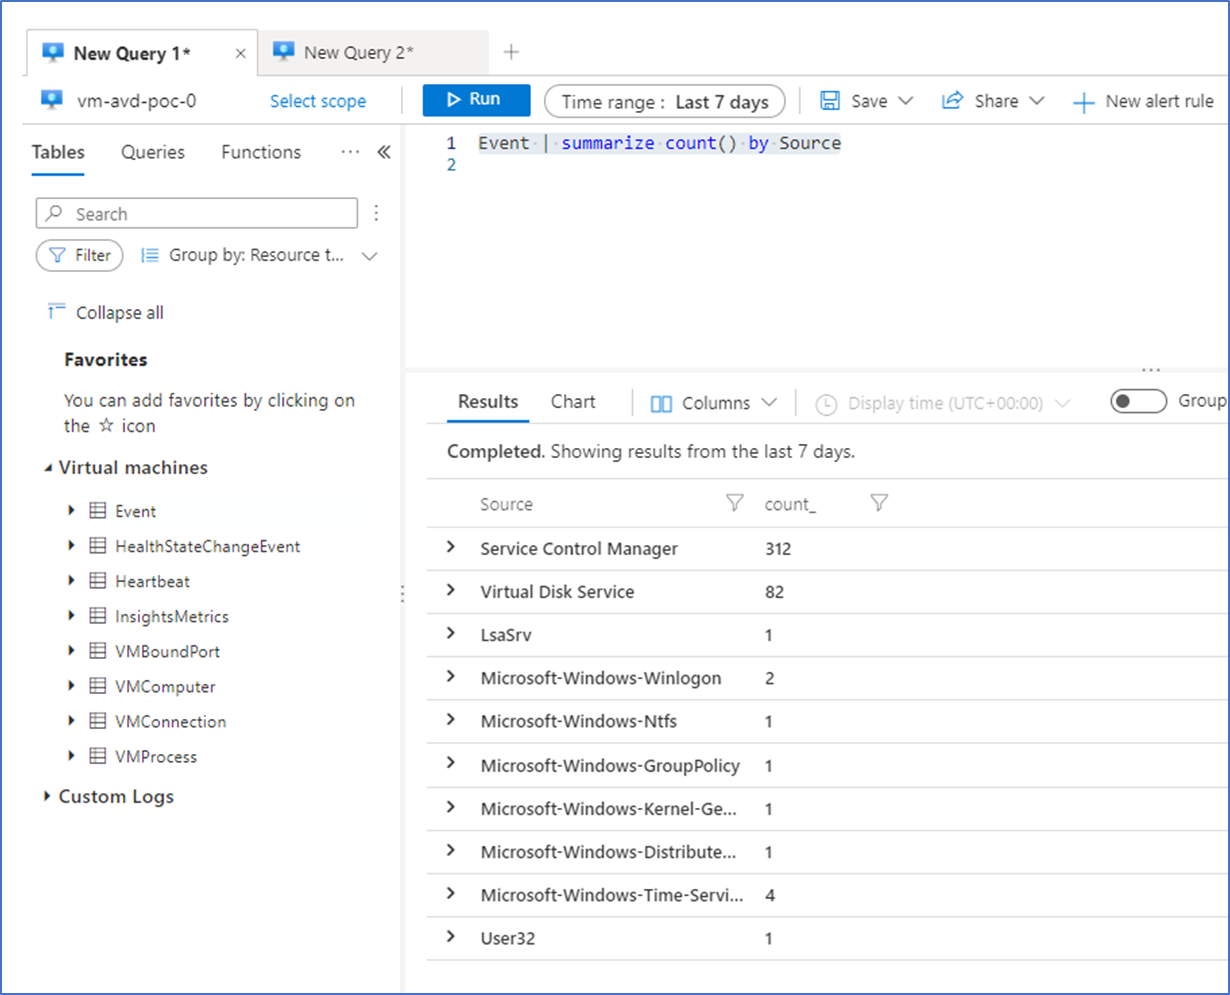
- Give it some time to populate the logs in the workspace, run the following command to see the results:
Event | summarize count() by Source

Monitor the service status
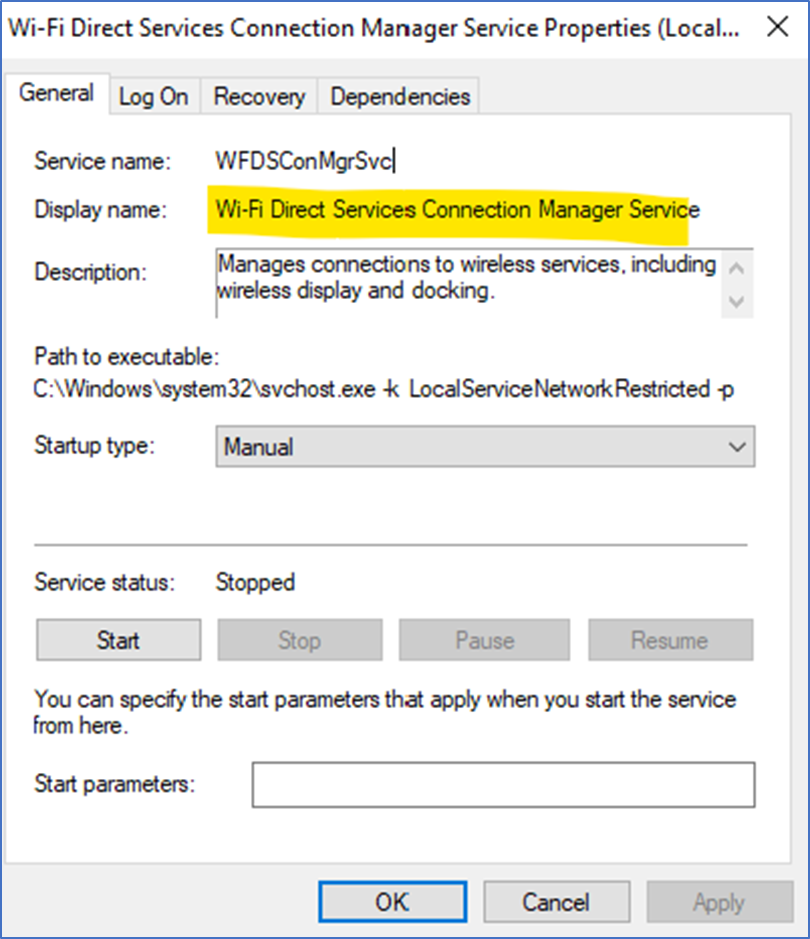
- Find the Service Display name from the windows services

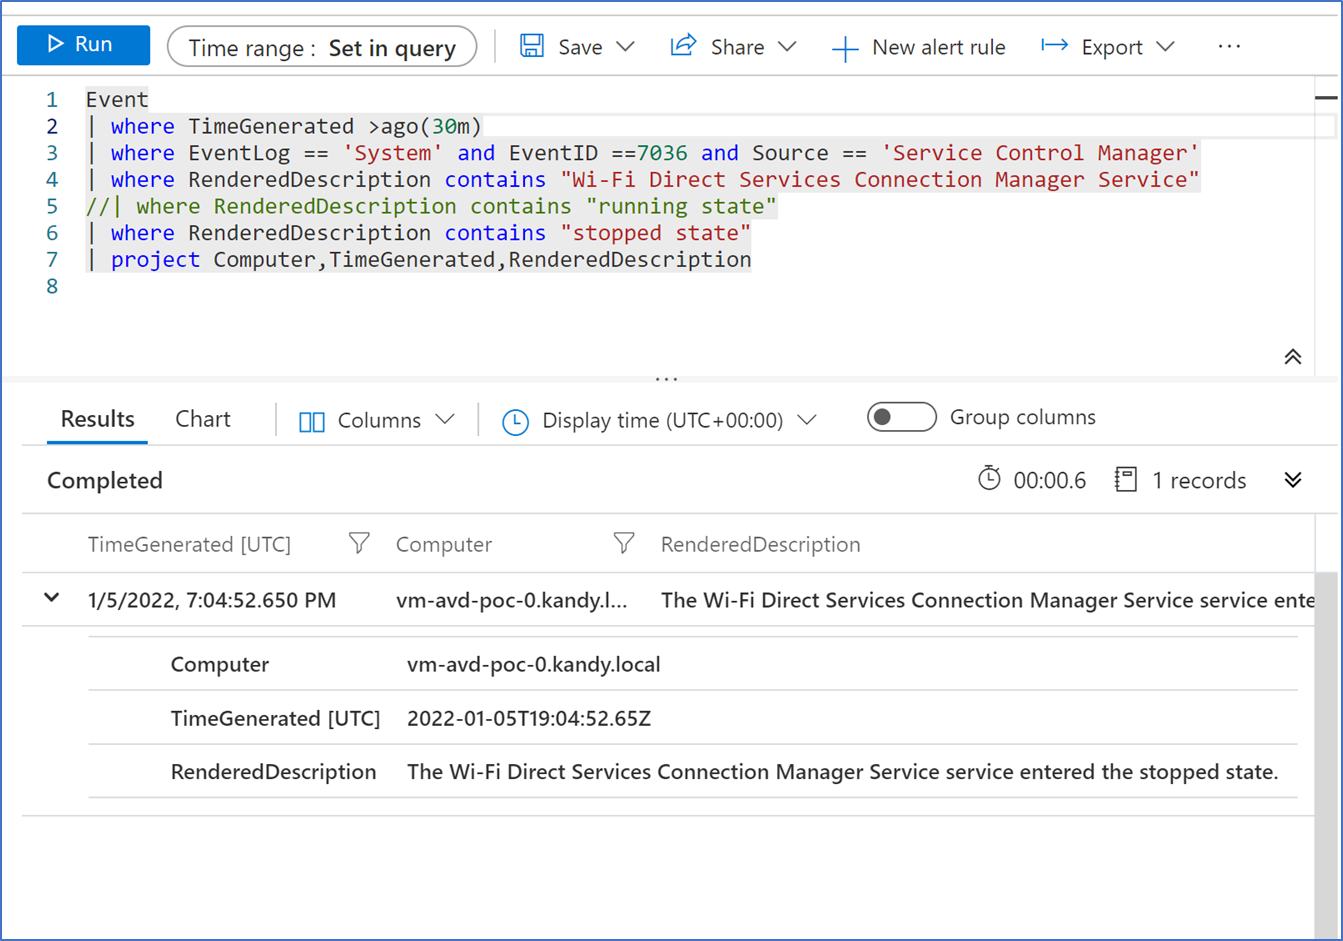
- Run the following query in Azure Monitor – Logs:
Event
| where TimeGenerated >ago(10m)
| where EventLog == 'System' and EventID ==7036 and Source == 'Service Control Manager'
| where RenderedDescription contains "Wi-Fi Direct Services Connection Manager Service"
//| where RenderedDescription contains "running state"
| where RenderedDescription contains "stopped state"
| project Computer,TimeGenerated,RenderedDescription
- Stop the service and run the query to see the results.

Create an Alert rule and Email notification
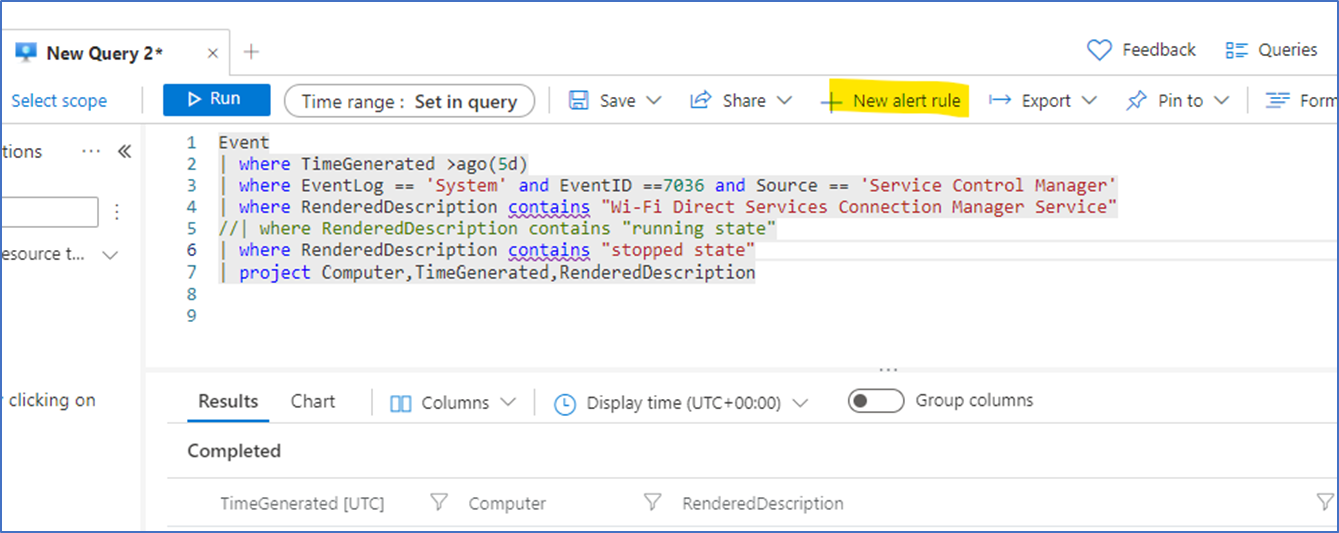
- To create an Alert rule to this query, click + New alert rule on top of the query window

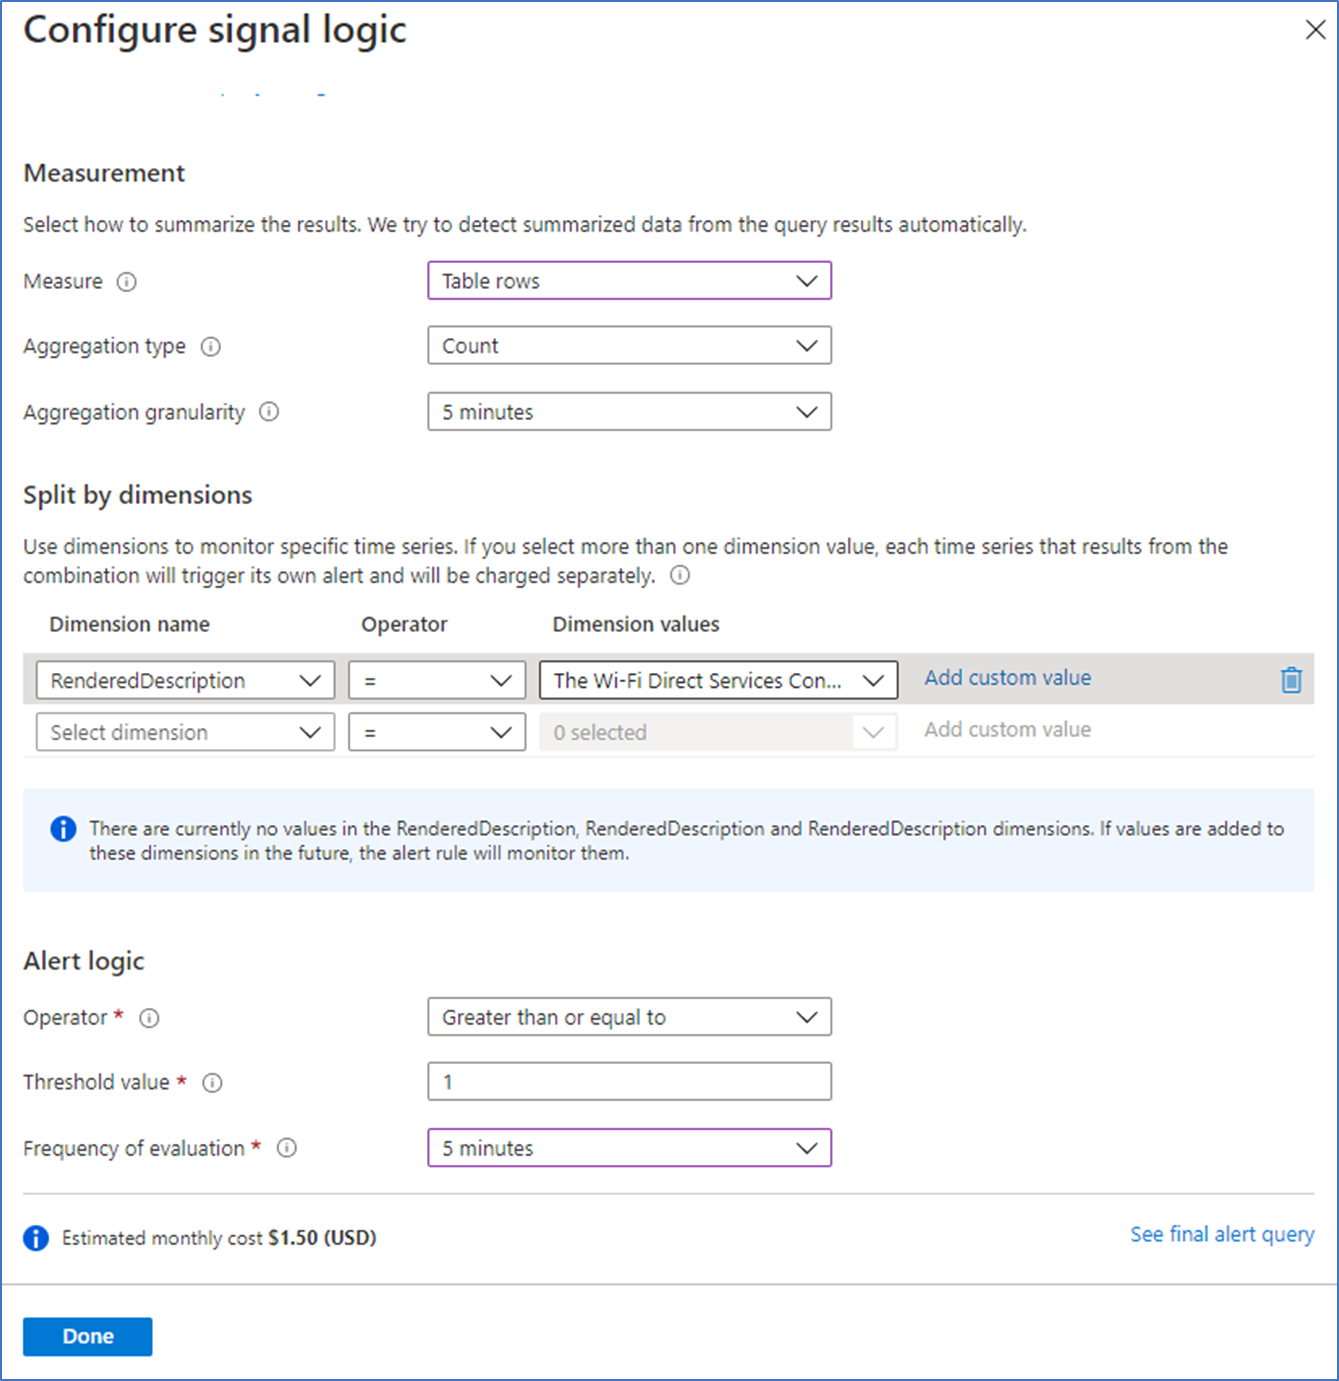
- Fill the alert condition and under Alert logic select Operator – Greater than or equal to and Threshold value as 1

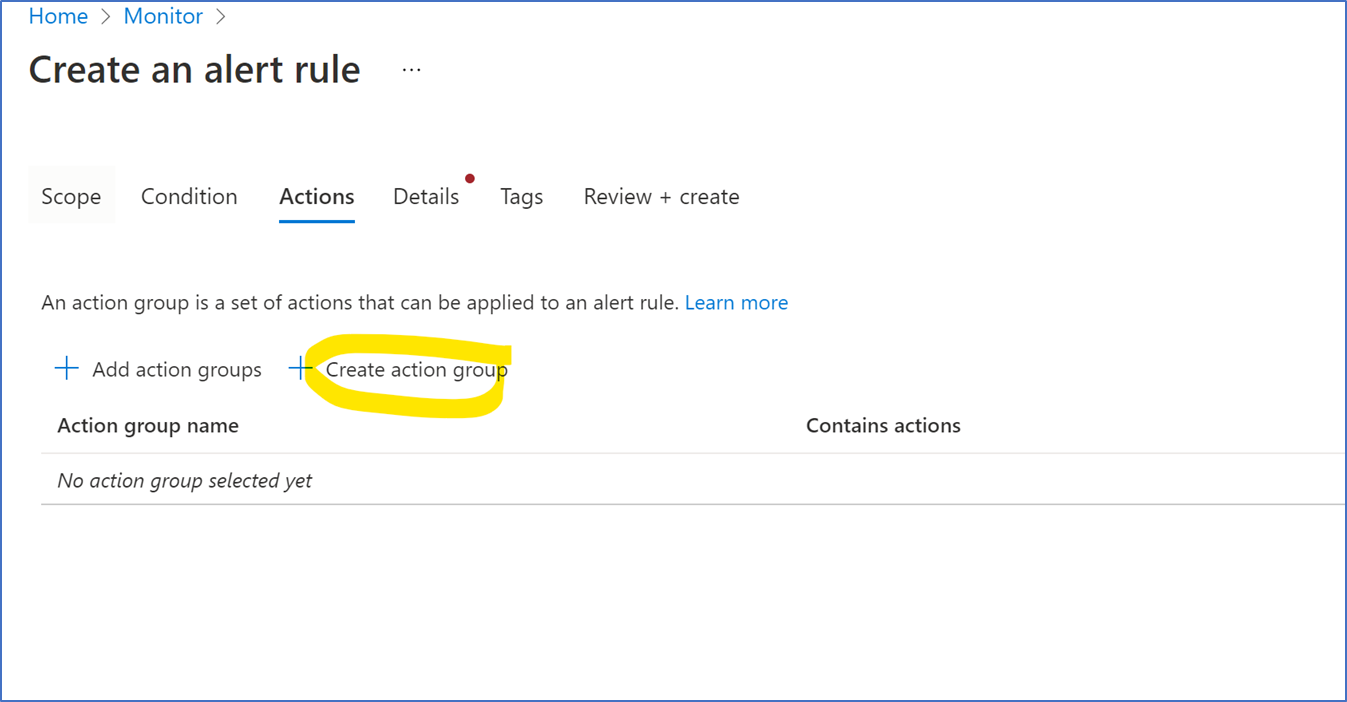
- In Actions select Create action group

- In notifications, select the notification type as Email/SMS message/Push/Voice and set the email address to notify

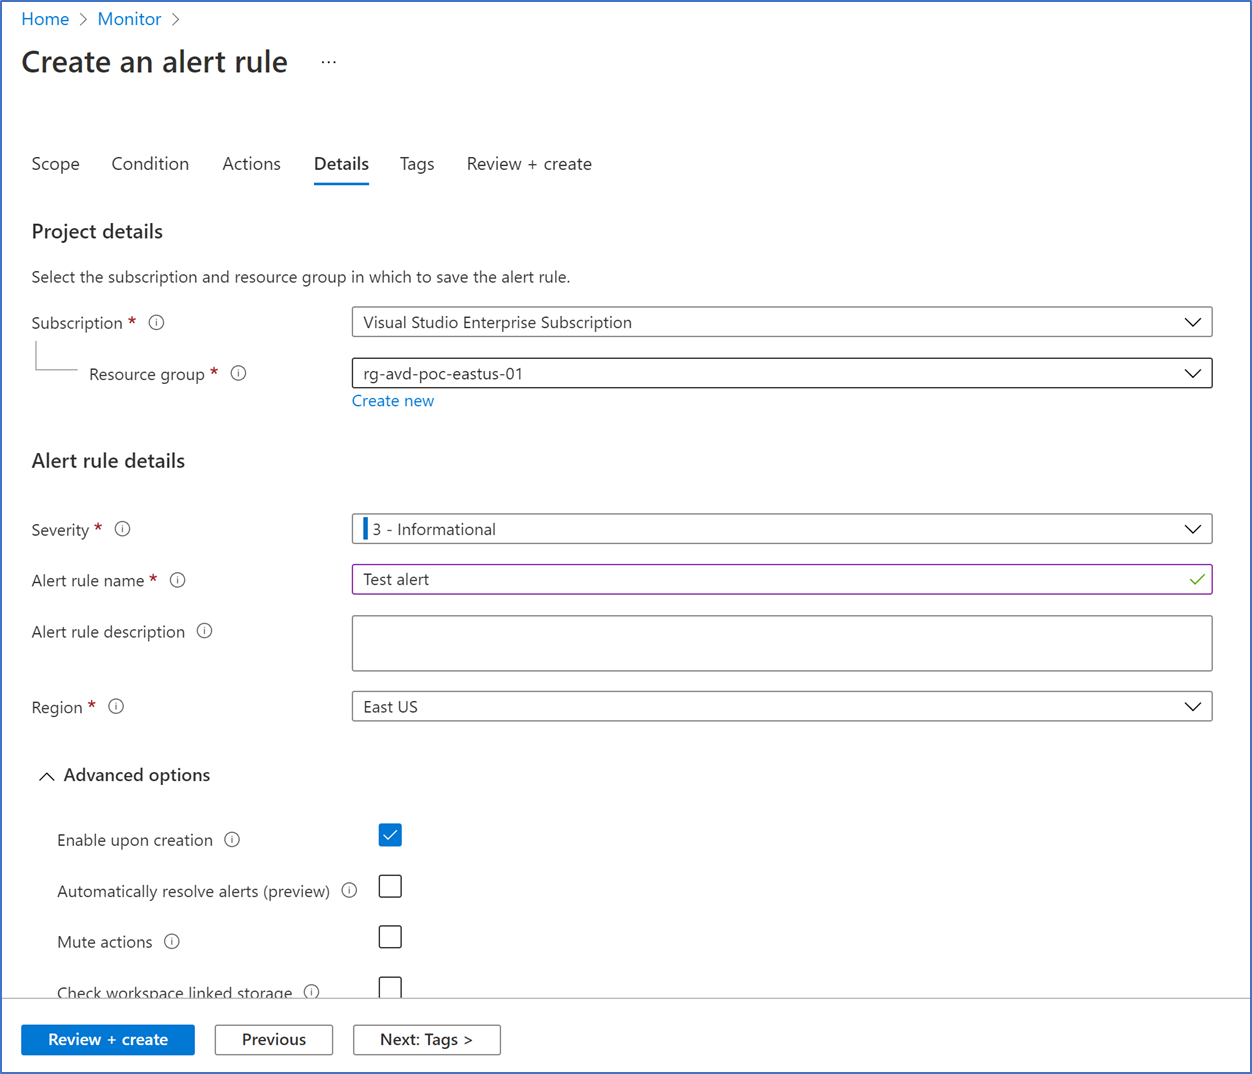
- In the details, provide Severity, Alert rule name and click Create

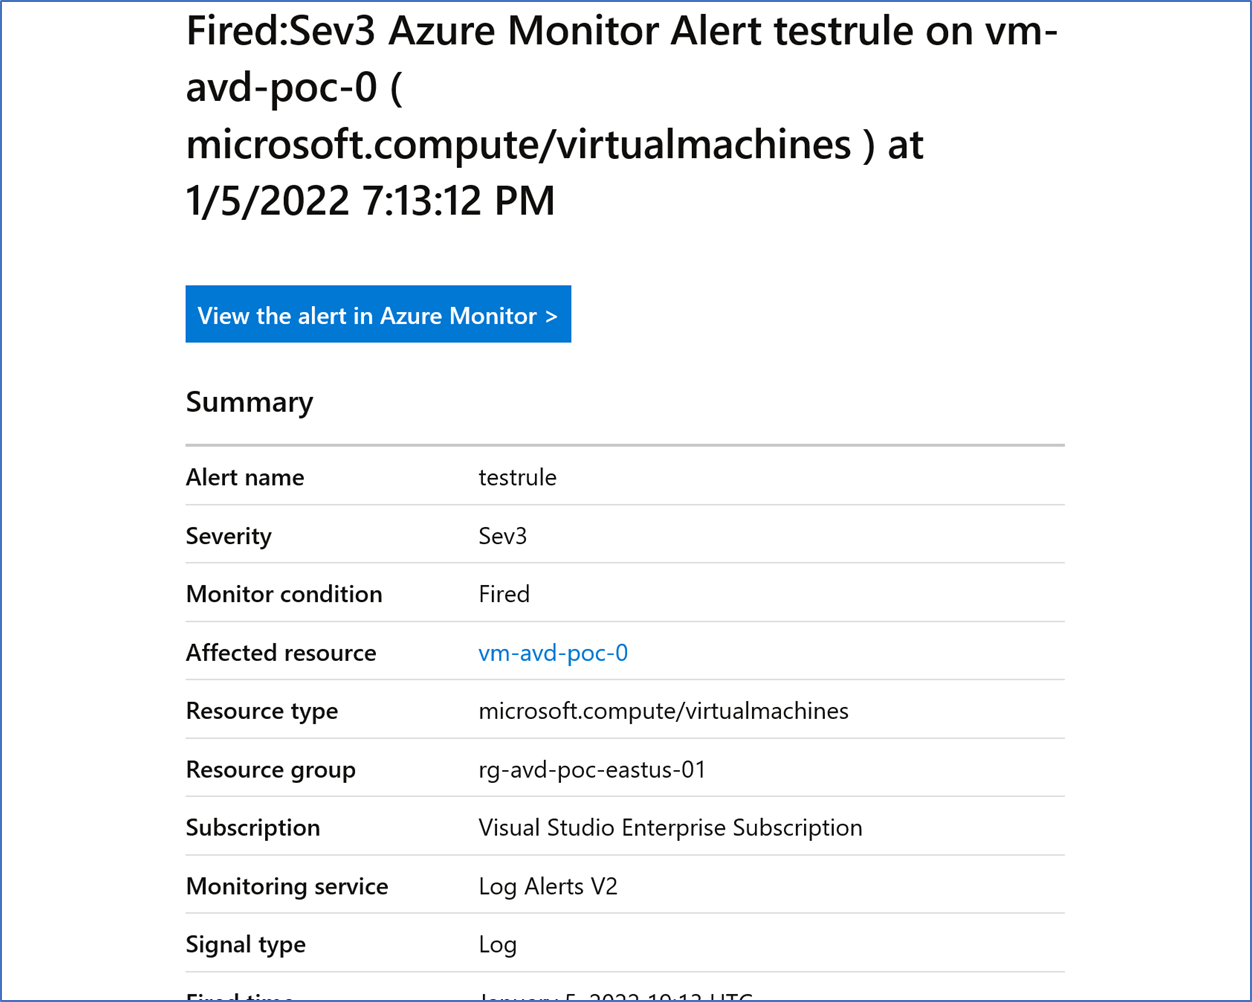
- If everything is configured correctly, you should get an email notification when the particular service is down.

Hope this post is useful
Cheers
