Application Performance Monitoring (APM) involves the processes and tools designed to monitor, analyze, and optimize the performance and availability of software applications. According to Gartner, a leading research and advisory firm, APM is defined as follows:
"Application Performance Monitoring is a discipline that provides visibility into the end-to-end performance of applications and supporting infrastructure. APM approaches focus on helping understand application performance issue impacting end-users."
Applications have become increasingly complex in today's environment. Many customers develop applications in distributed environments, making gaining visibility into certain areas of their operations challenging. Usually built on microservices that depend on one another, these applications frequently leave customers struggling to understand the underlying dependencies and interactions.
Customer Challenges
Complex microservice architectures: Over the years, customers have commonly highlighted challenges related to APM. Modern application architectures are highly complex, making understanding the relationships and dependencies between components difficult. Customers often seek greater visibility into these intricate systems. Without proper insights, identifying performance bottlenecks or troubleshooting issues becomes challenging.
Lack of standard application metrics: Customers often combine different telemetry signals to understand application performance. Various microservices generate different types of metrics, but these often do not directly correlate to overall application performance. This lack of uniformity makes getting a unified view of the application's health difficult.
Difficult to prioritize with business goals: Let's assume the first two challenges have been addressed. Many customers struggle to determine which triggered alarms are most critical to the business and require immediate attention. Without a clear way to differentiate between them, this often leads to alarm fatigue, where important alerts are overlooked, and critical issues go unresolved. As a result, businesses may experience prolonged downtime or performance degradation, impacting both user experience and revenue.
Disjointed monitoring experience: Customers often use various APM tools, such as synthetic monitoring or tracing, but these tools are not integrated cohesively. There is no single, unified dashboard where customers can easily view their application's overall performance. Instead, they must navigate multiple platforms and correlate the information, leading to a disjointed and inefficient experience.
Addressing Customer Needs
It is important to consider customer needs, and these are some ways to address those requirements.
Discover services: The first capability helps you identify the various resources or microservices underlying the application. This enables a better understanding of the components that make up the application and their dependencies and provides a clearer view of the application's architecture. With this visibility, teams can quickly identify potential bottlenecks or failures within the system.
Standard application metrics: The goal is to establish standardized metrics that accurately reflect application performance. Key performance indicators, such as traffic volumes, availability, latency, fault, and error rates, are critical for assessing application performance. These metrics help teams monitor the application's health and quickly identify issues. Focusing on these golden signals makes it easier to measure overall performance, detect bottlenecks, and address any failures or anomalies.
Service Level Objectives (SLOs): The next step is defining custom SLOs for the application. Many customers have expressed that, to meet their SLAs, they must establish their own SLOs. Each company has unique requirements, and customizing SLOs ensures that critical business needs are met. This capability helps prioritize the most mission-critical issues, enabling teams to focus on what matters most and address performance challenges that directly impact business operations.
Navigate from metrics to the root cause in three clicks: The goal is to provide a solution that allows users to quickly identify the root cause of an issue with minimal effort. With this capability, it is possible to trace from high-level metrics to the underlying problem in just three clicks. This streamlined approach enables faster troubleshooting and issue resolution, allowing teams to respond to performance problems more efficiently.
Use cases
Here are some common use cases that customers have shared regarding Application Performance Monitoring.
Analyze and debug applications: The primary goal of APM is to gain insights into application performance and to have the tools necessary to resolve issues when they occur. This involves monitoring the application's behavior and identifying the root cause of any performance problems, enabling teams to take corrective actions quickly and efficiently.
End-to-end container observability: There are also tight integrations with the infrastructure layer to provide comprehensive end-to-end container observability for applications built in containerized environments, specifically when using AWS EKS. This integration allows for detailed monitoring of the application and its underlying infrastructure, ensuring full visibility across the container lifecycle.
Monitor Service Level Objectives: This capability allows you to define and track your own SLOs, enabling you to monitor application performance against these objectives. It helps ensure that you can focus on the most critical issues by providing visibility into the areas that matter most for your business.
Amazon CloudWatch
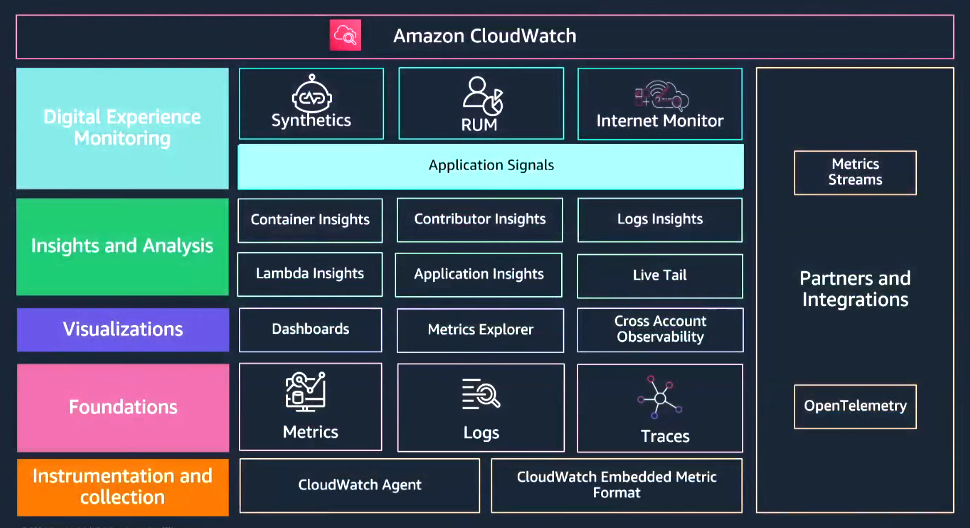
Amazon CloudWatch, AWS's native observability service, offers a comprehensive range of capabilities beyond foundational level logs, traces, and metrics. While many customers are familiar with CloudWatch's core features, such as logs, traces, and metrics, they often overlook its advanced capabilities. These include various dashboards for visualizing insights, cross-account observability for broader visibility, and robust investments in analytics and insights to enhance the observability experience. These advanced features are designed to provide deeper insights into application performance and system health.

Amazon CloudWatch Application Signals
Application signals automatically collect golden metrics, availability, the volume of requests, latency and faults, errors, and application traces, providing a comprehensive view of operational health. This is achieved without writing custom code or creating custom dashboards, as everything is handled seamlessly. Let's explore how application signals can simplify your monitoring process and become an indispensable tool for managing your applications.
Best practice service operator dashboards: Application signals offer pre-built dashboards designed to display critical operational data in a clear and optimized format in one place. These dashboards automatically discover your services, making it easy to identify anomalies and investigate them further. They also provide the ability to dive deeper into specific services and inspect their dependencies for a comprehensive understanding of your system's performance.
Golden application metrics: Key metrics such as availability, volume of requests, latency, faults, and errors are automatically discovered and tracked out of the box. These metrics are provided for every service, operation, and dependency within the application, ensuring comprehensive visibility into performance and health.
Service Level Objectives (SLOs): Modern application owners use SLOs to define performance goals that align with business and customer expectations. With application signals, AWS CloudWatch provides a native solution for setting, monitoring, and reporting these SLOs, offering seamless integration and visibility into application performance.
Quickly arrive at the root cause: Application signals correlate your critical telemetry data, enabling navigation from golden metrics to correlated traces. This streamlined process allows you to identify the root cause of an incident in just a few clicks, significantly reducing troubleshooting time and improving resolution efficiency.
How it works?

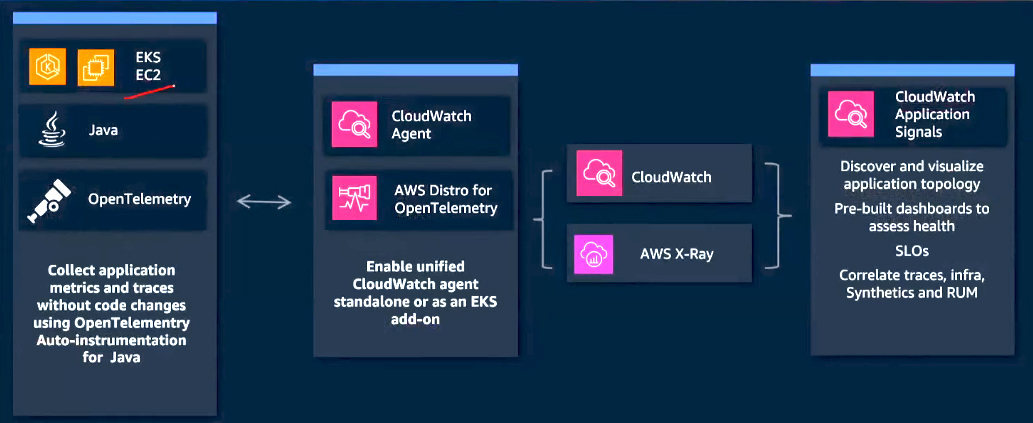
On the left side, a Java application running on AWS EKS or EC2 is depicted. To get started, no code changes are required. Simply configure the unified Amazon CloudWatch Agent, which combines the setup for the CloudWatch Agent and the AWS Distro for OpenTelemetry (ADOT) into a single step. For applications running on EKS, the CloudWatch Agent can be enabled directly on your cluster as an EKS add-on. Once the add-on is enabled, the ADOT Java Agent injects the OpenTelemetry Auto-Instrumentation Library for Java. This configuration enables the collection and transmission of application data to Amazon CloudWatch and AWS X-Ray. With this setup, application signals automatically discover all your services and their dependencies. It also provides application topology visualizations, offering a clear view of your application's architecture and current state.
Reference:
AWS Events
